Our GHG Emissions
Our Pathway to Net Zero
The strategies outlined in Resilient Watertown's Climate & Energy Plan are designed to help us reach our climate goals. The chart below shows the opportunities for greenhouse gas (GHG) emissions reductions in our community through 2050.
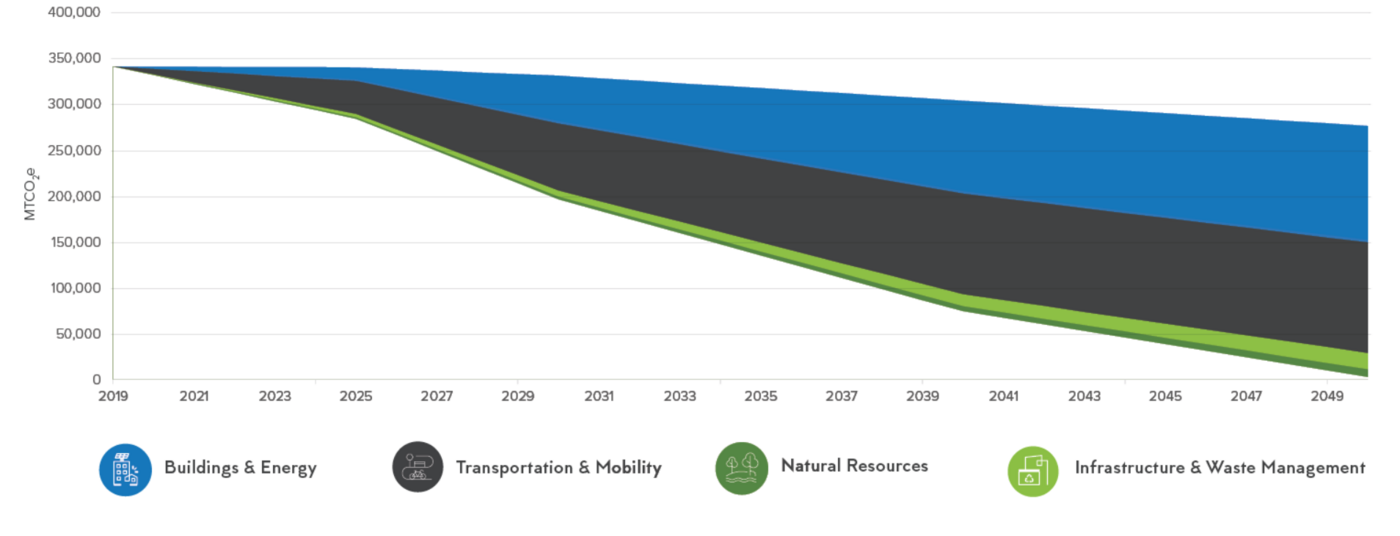
Source: 2019 Greenhouse Gas Inventory
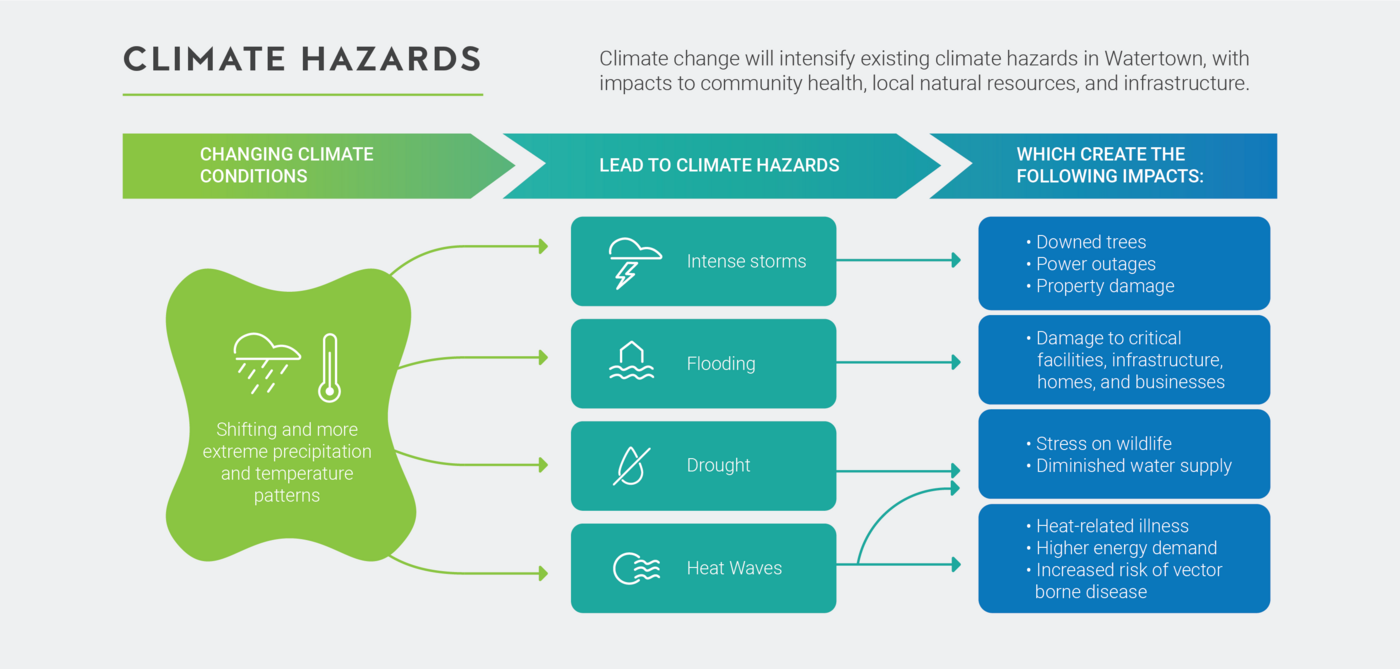
Climate Hazards
Climate Change in Watertown
Understanding how climate change trends and projections will play out in Watertown allows us to identify the greatest opportunities for climate resilience actions. Changing climate conditions, like temperature and precipitation, exacerbate existing climate hazards in Watertown, which brings direct impacts to community health, local natural resources, and infrastructure.
Drought
Drier Days
Even though more annual precipitation is projected overall, it is anticipated to fall in fewer, more intense events in the winter and spring rather than in smaller more sporadic events throughout the year. Therefore, it is expected that there will be longer periods of time without rainfall, especially in the summer and fall, increasing the potential for drought. In October 2016, 52% of the land area in Massachusetts was in “Exceptional Drought.” Between 2001 and 2017, Watertown experienced 48 weeks of “Severe Drought” and 21 weeks of “Extreme Drought.”
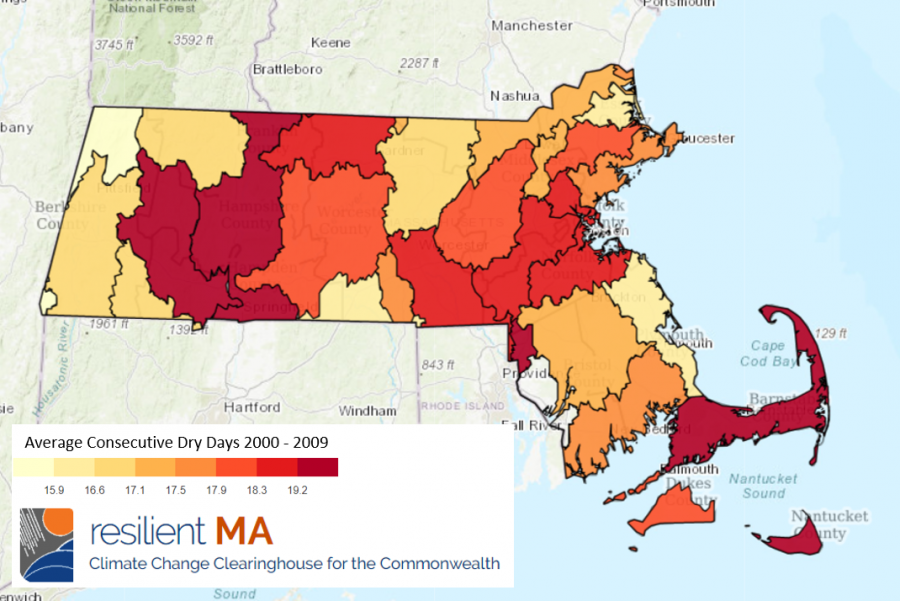
Observed Drought Conditions from ResilientMA.org/map
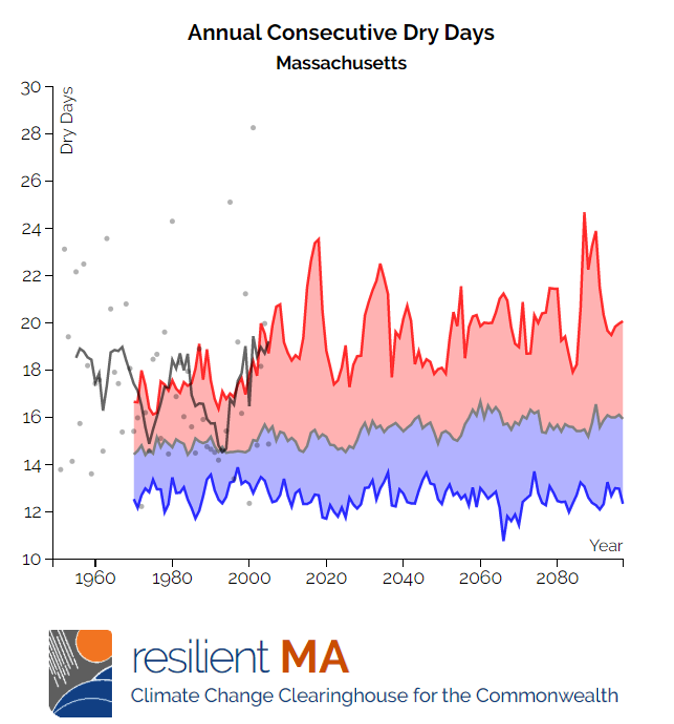
Chart Available at ResilientMA.org
Drought
Longer Dry Spells
While on average the likelihood of drought conditions stays relatively flat, some climate models result in scenarios where periods of exceptionally long drought are possible.
Climate Hazards
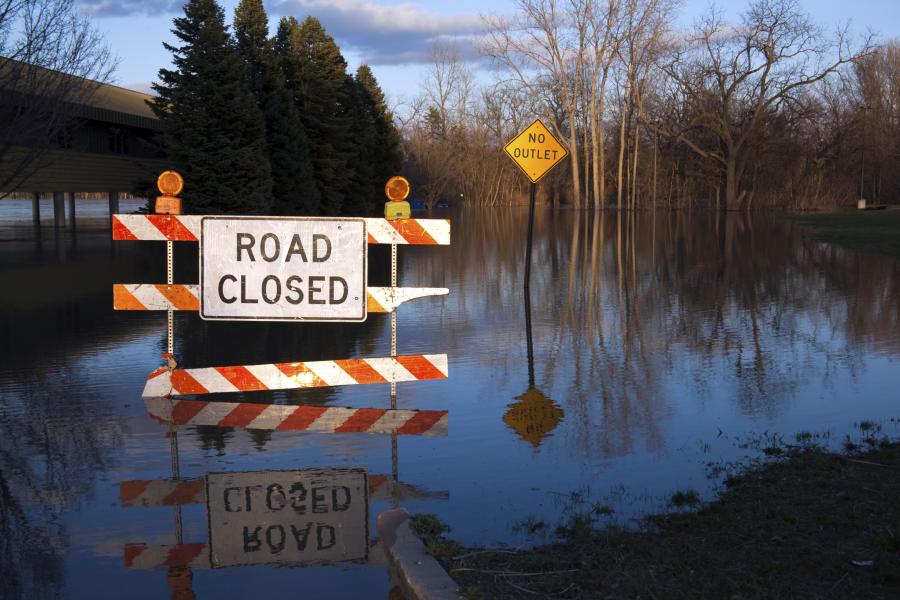
Extreme Rainfall and Flooding
Over the last several decades, the entire Northeast has seen a remarkable increase in the amount of precipitation falling during extreme rainfall events, leading to localized flooding. The Commonwealth has experienced 22 flood-related disasters from 1954 to 2017. According to the National Oceanographic and Atmospheric Association Storm Events Database, Middlesex County saw $35.2 million worth of damage from flooding in March of 2010.
Climate Hazards
Temperatures are Increasing
By mid-century, this number is expected to rise by an additional 10 to 35 days. Climate model projections like the ones shown here illustrate the range of possible future outcomes. The grey line in the middle represents the average of all predictions, however some models indicate that dramatic increases in hot days are possible.
While the top of the chart may be most eye catching, the bottom of the range is also relevant to consider. Historically there have been years where very hot temperatures did not occur, but that possibility becomes increasingly unlikely in the future.
Climate models only show the number of days of heat that are expected, however as those numbers rise, it is also likely that more of those days will be consecutive in the form of heat waves.
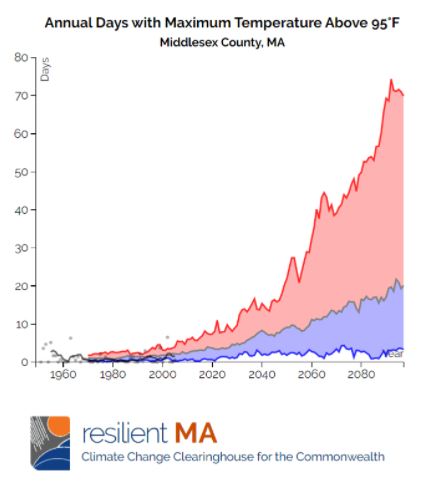
Chart Available at ResilientMA.org
Climate Hazards
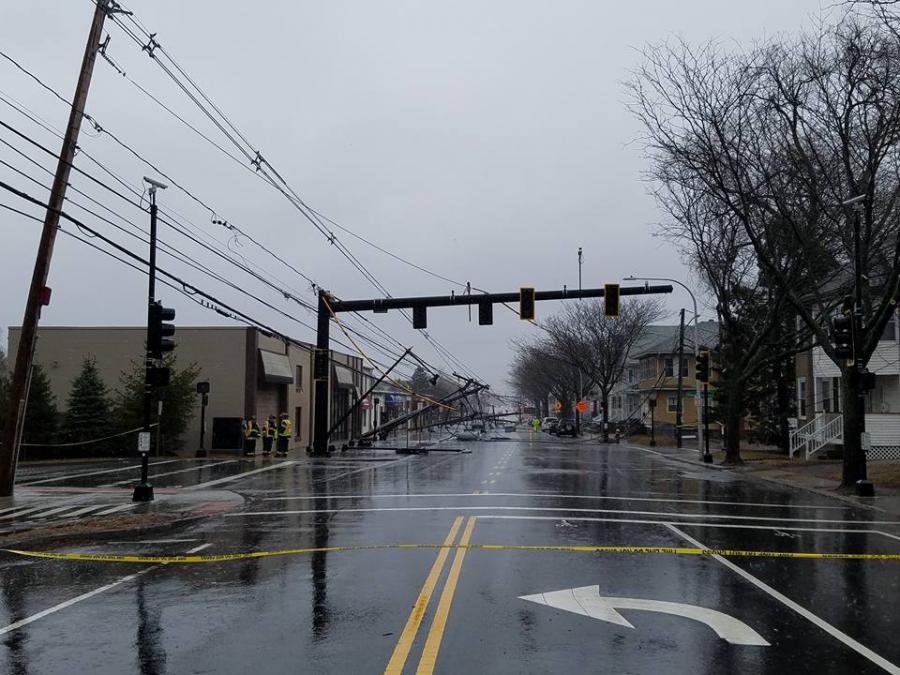
Intense Storms
Over the last several decades, the number and intensity of storms has been on the rise. This includes hurricanes, nor’easters, ice storms, and rainstorms. Research from Resilient MA shows that these types of storms are likely to become more frequent, intense, and possibly longer in duration in the future.
This image of Arsenal St. in 2018 illustrates the impact these intense storm events are having on Watertown today.
MVP Program
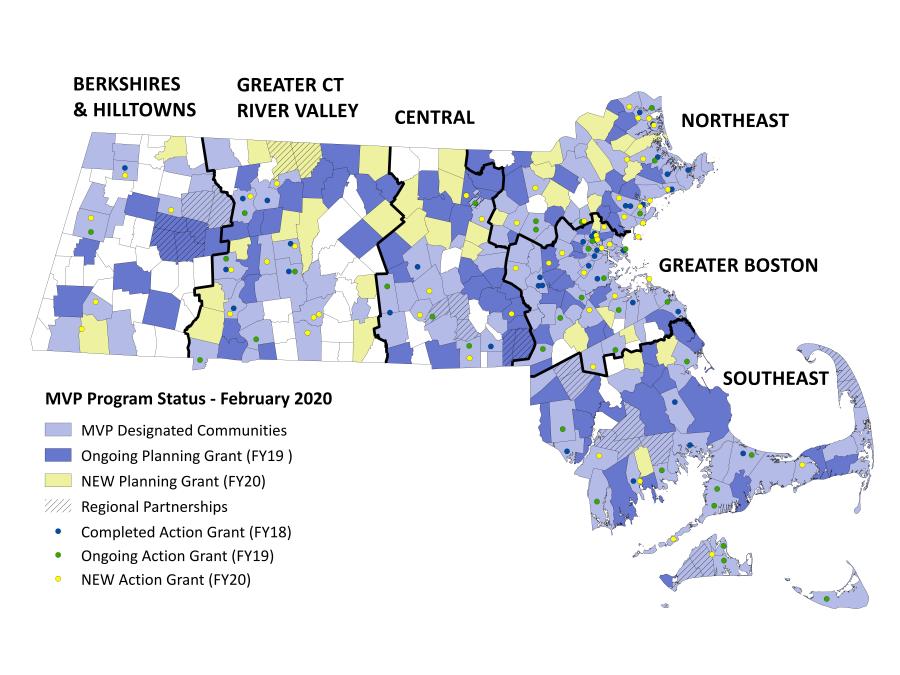
Municipal Vulnerability Preparedness (MVP) Program
The Baker-Polito Administration’s Municipal Vulnerability Preparedness (MVP) grant program provides support for cities and towns across the Commonwealth to identify climate change vulnerabilities, prioritize critical actions, and build community resiliency.
Building on the Administration’s approach to state and local partnerships, the MVP program awards municipalities with funding and technical support to complete a community-led planning process to:
- Define extreme weather and natural and climate change related hazards
- Identify existing and future community vulnerabilities and strengths
- Develop and prioritize actions and opportunities to reduce risk and build resilience
Once a municipality has completed the planning process they become eligible for follow-on funding opportunities, including MVP action grants, and advanced standing in other grant opportunities.
Watertown became an MVP Community in 2020.
MVP Program
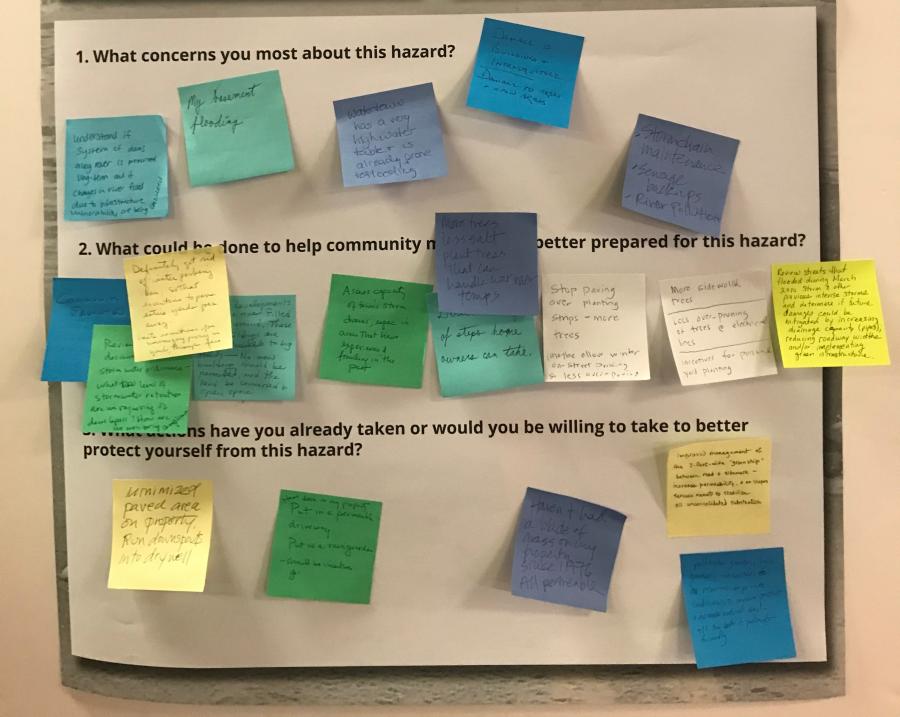
MVP Program Top Concerns
During the 2020 MVP process, community members indicated their top concerns include:
- Intense Storms: Damage to infrastructure, transit, and communication systems due to falling trees and poles, power outages, and runoff into the Charles River
- Flooding: Impact to buildings due to flooding in basements, vulnerability of dams, river pollution, and stormwater drainage system capacity
- Drought: Water scarcity and impact on health of trees and plants
- Extreme Heat: Increased energy demand and cooling needs of vulnerable populations, including seniors living without air conditioning, outdoor workers, and children, as well as transportation to cooling centers